We asked over 300 Spotlight users to take part in an Instagram Analytics survey to help us understand their social media marketing strategy.
Specifically, we were interested in what they look for to help them improve their Instagram feeds.
The results were interesting and we learned a lot about what to work on for our latest Spotlight feature – Analytics (included in the All Access plan).
In this post, we aim to help you make the most out of Instagram and Spotlight’s analytics features by debunking some myths and giving you actionable strategies.
Let’s get into the stats.
Here’s what we discovered:
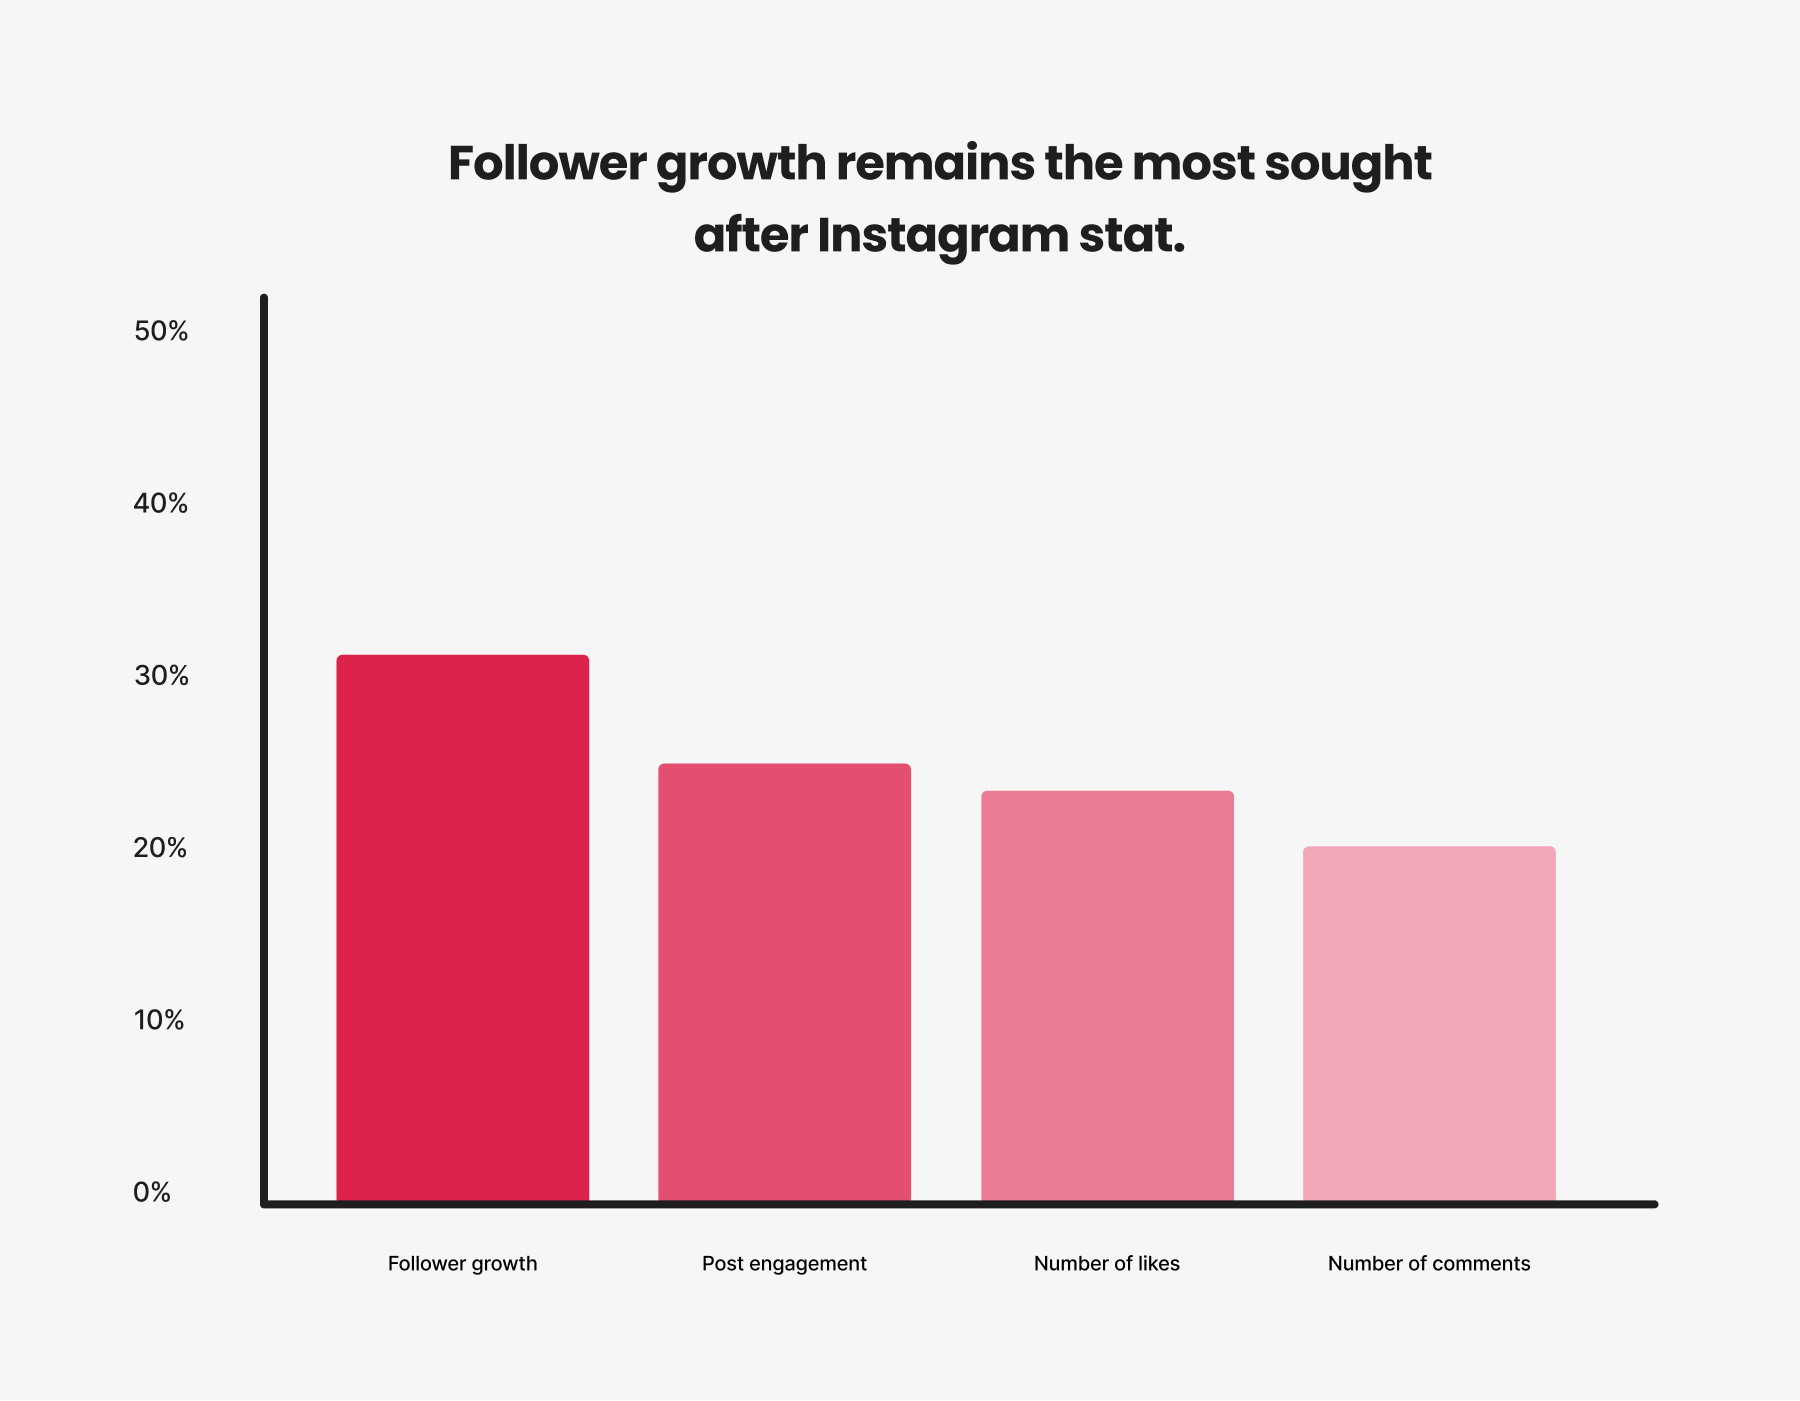
- 33% of voters were interested in follower growth stats.
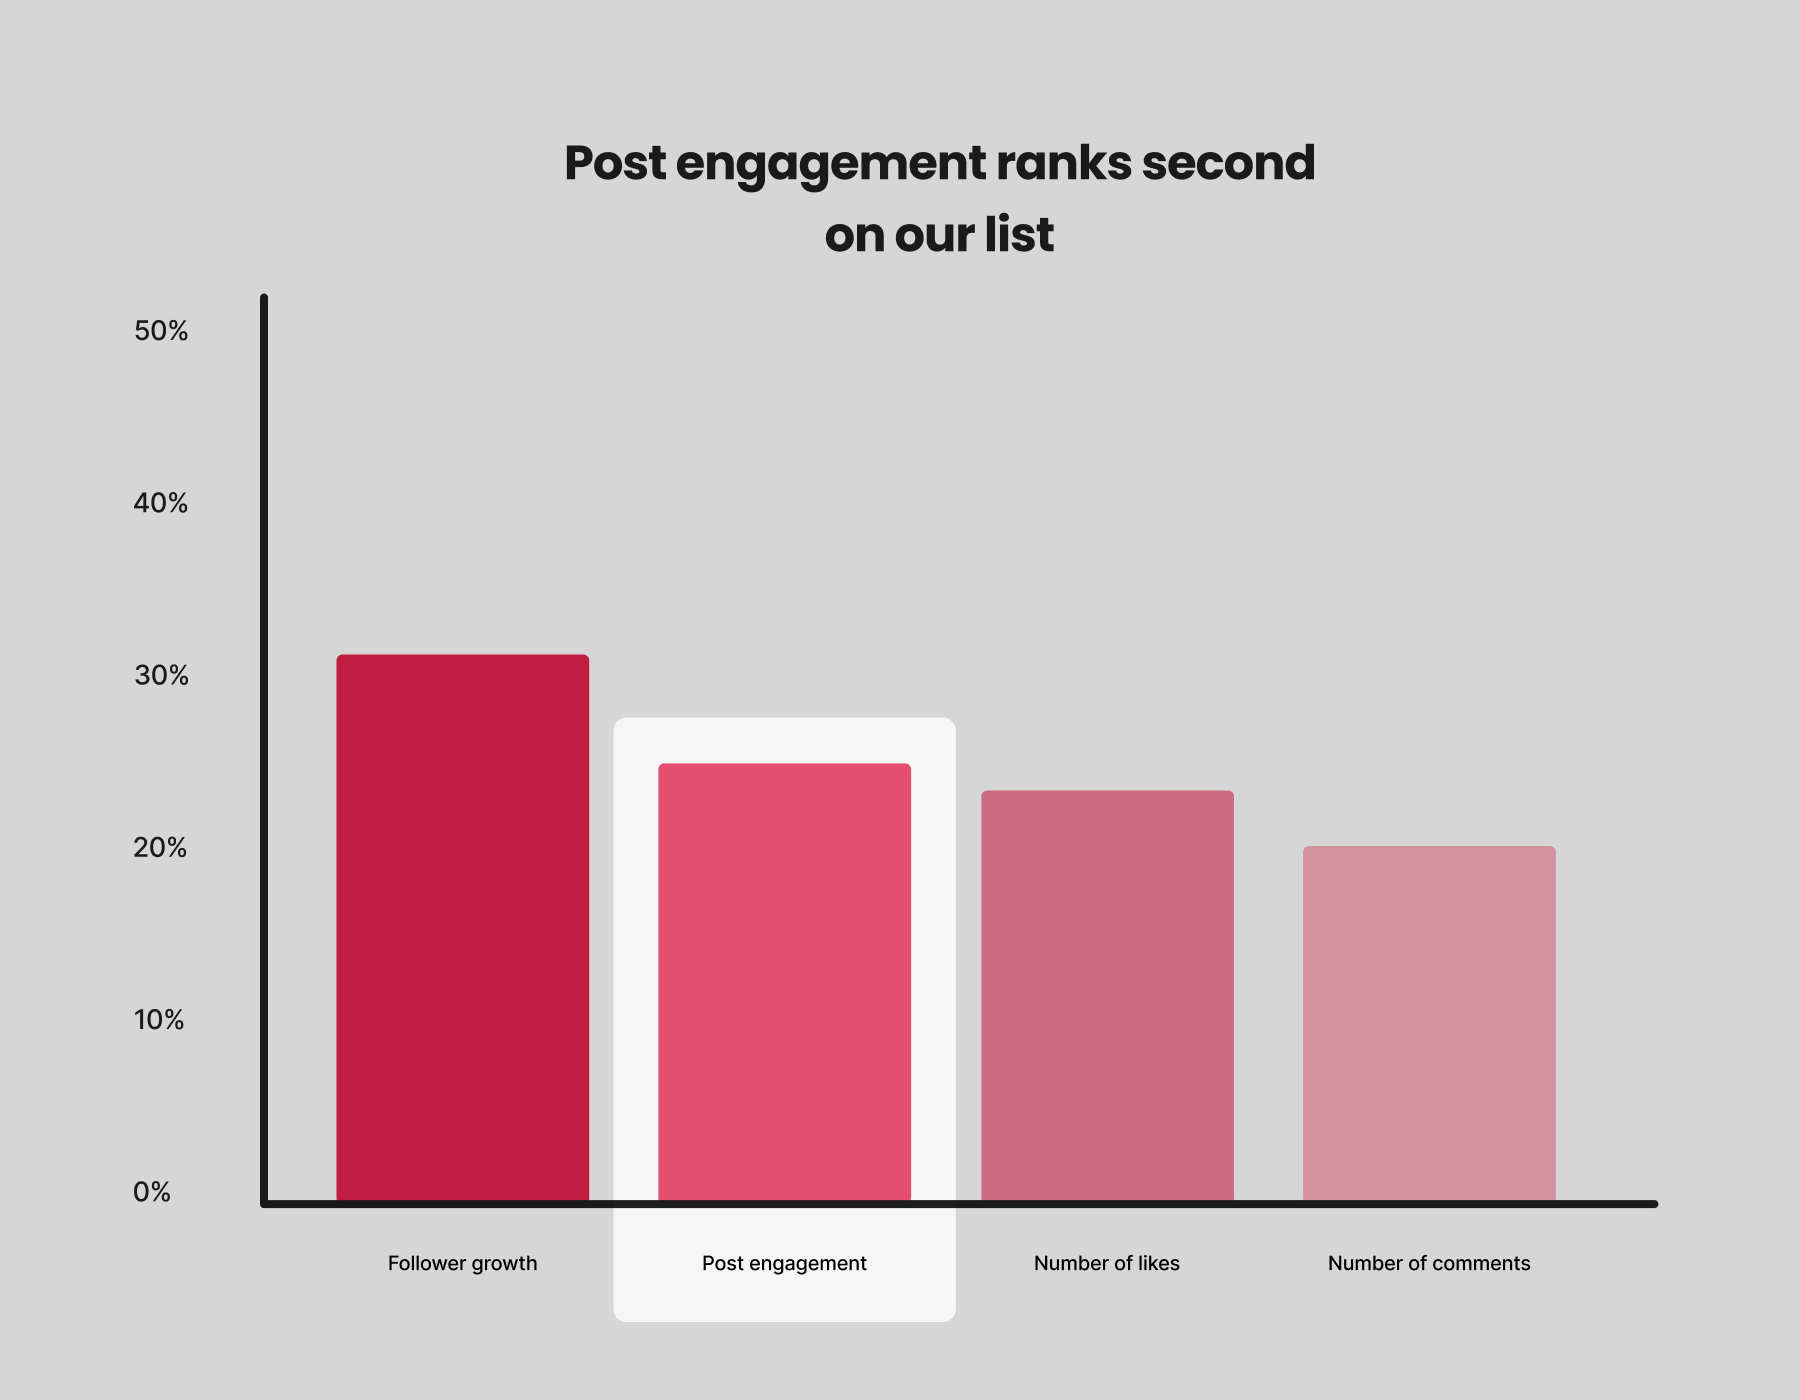
- Post engagement is the 2nd most sought-after metric for Instagram feeds.
- Participants were more interested in like count than comment count.
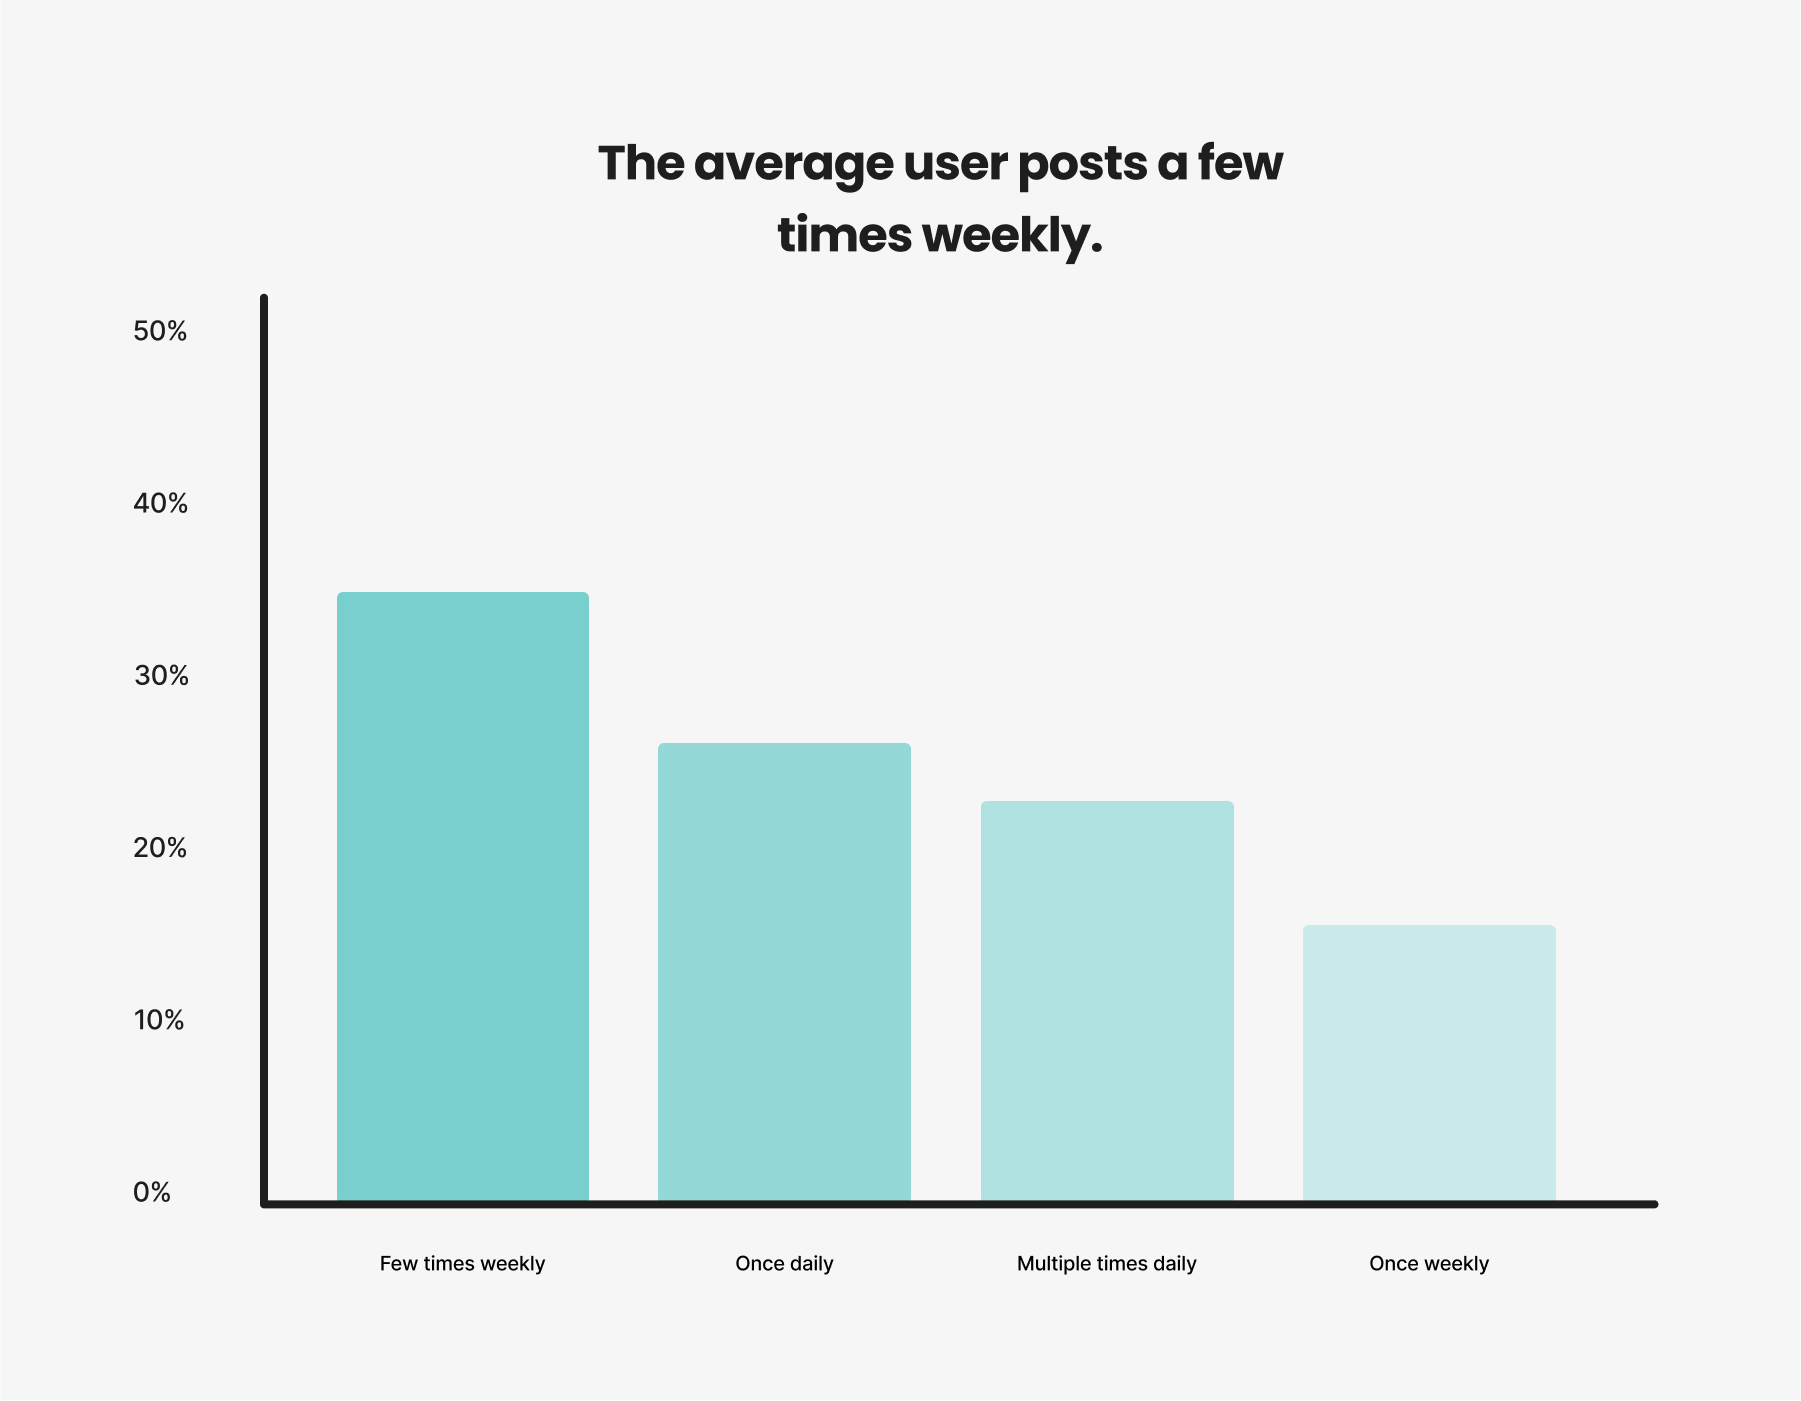
- Over 35% of voters post to Instagram a few times weekly.
- 50% of our participants post once or multiple times daily.
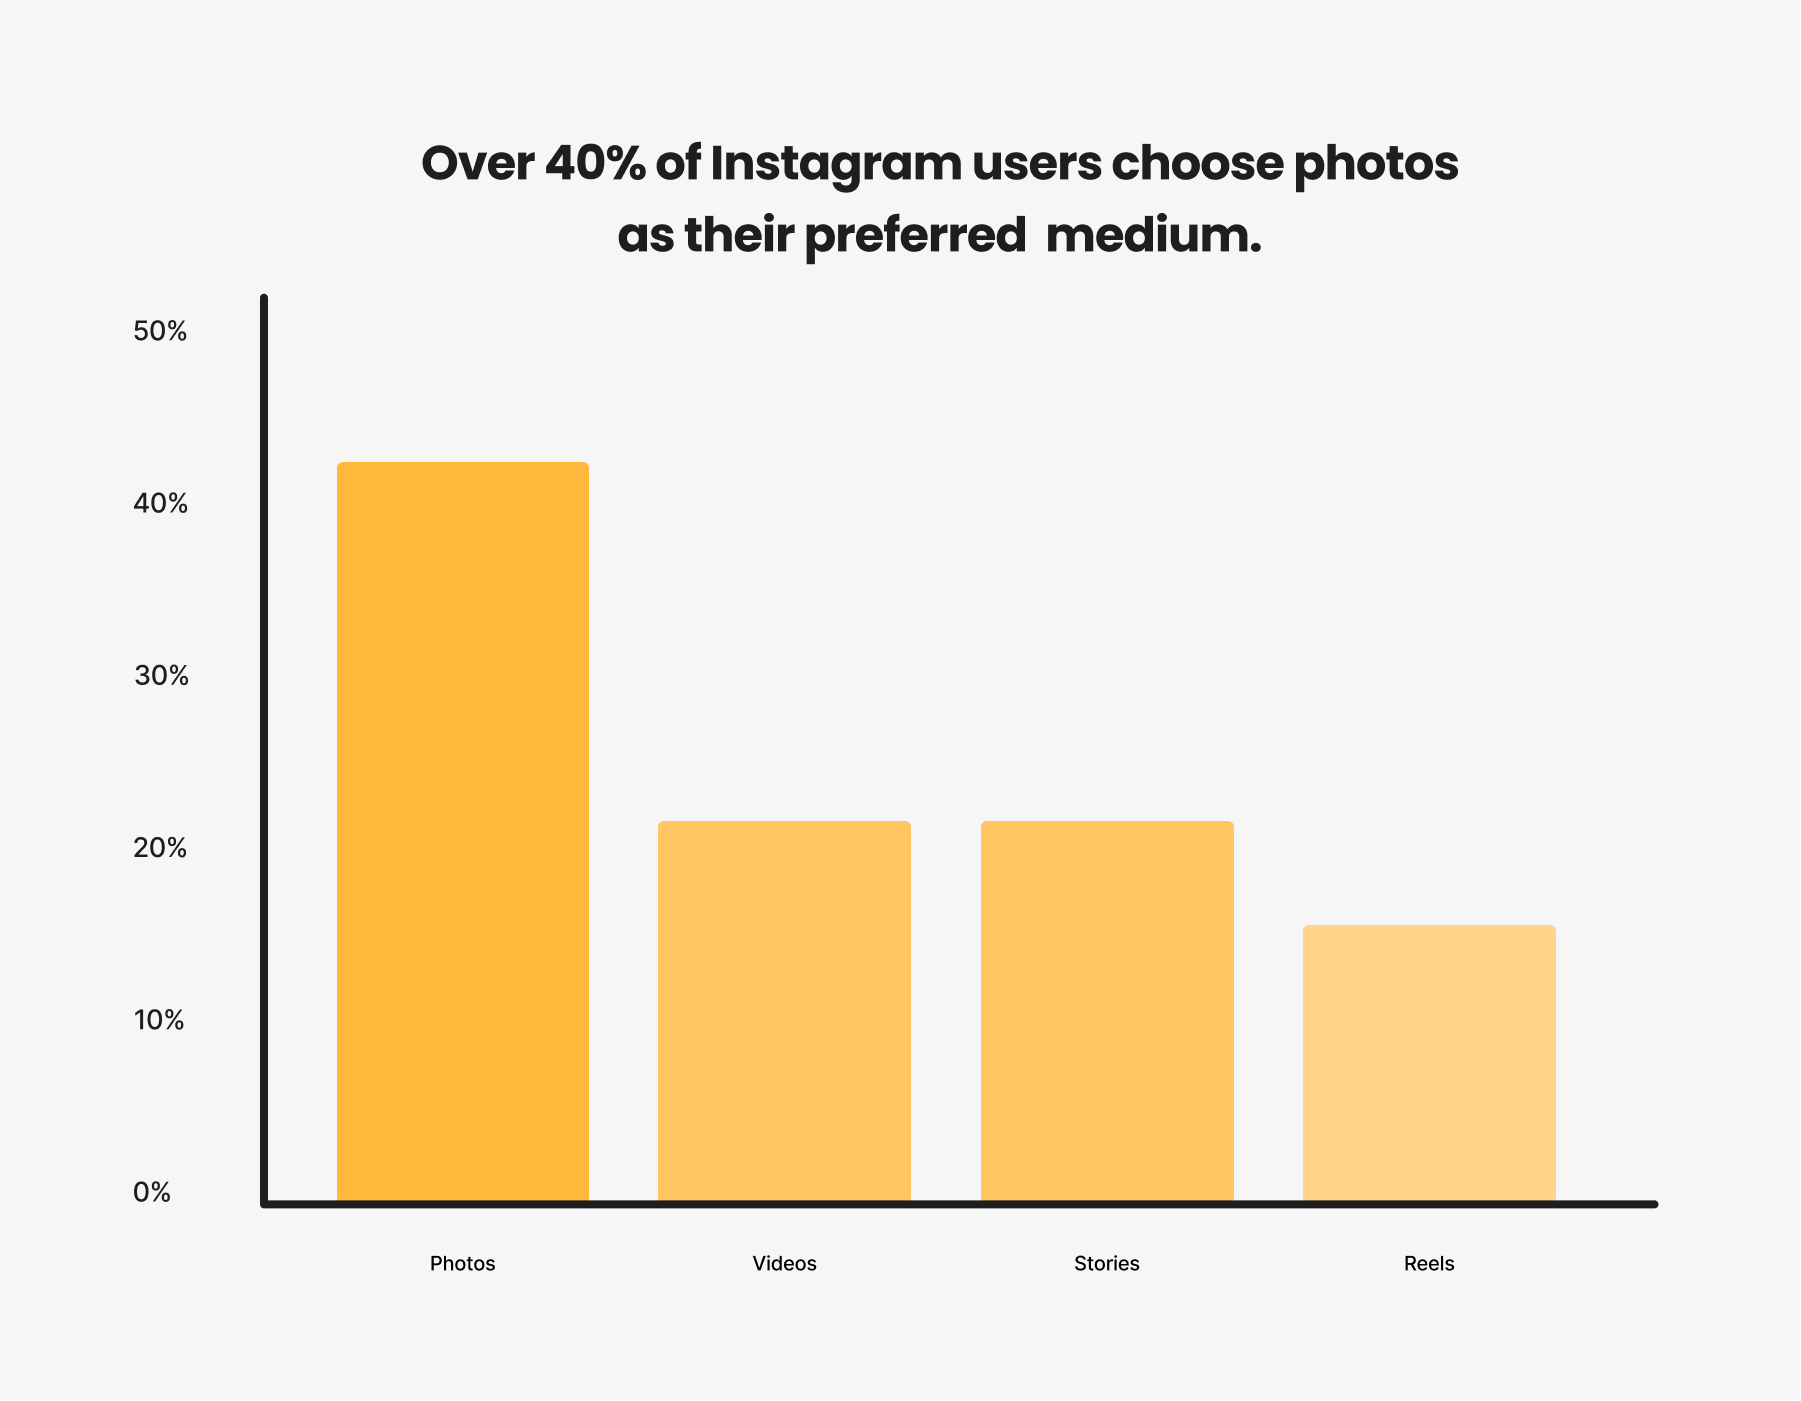
- 42% of participants chose photos as their number one Instagram medium.
- Videos were voted the 2nd most posted Instagram format.
- Reels were not so popular among our voters.
Follower growth stats was the most requested feature
With most businesses having a benchmark for growth, it is no surprise that most of our participants were interested in this stat.
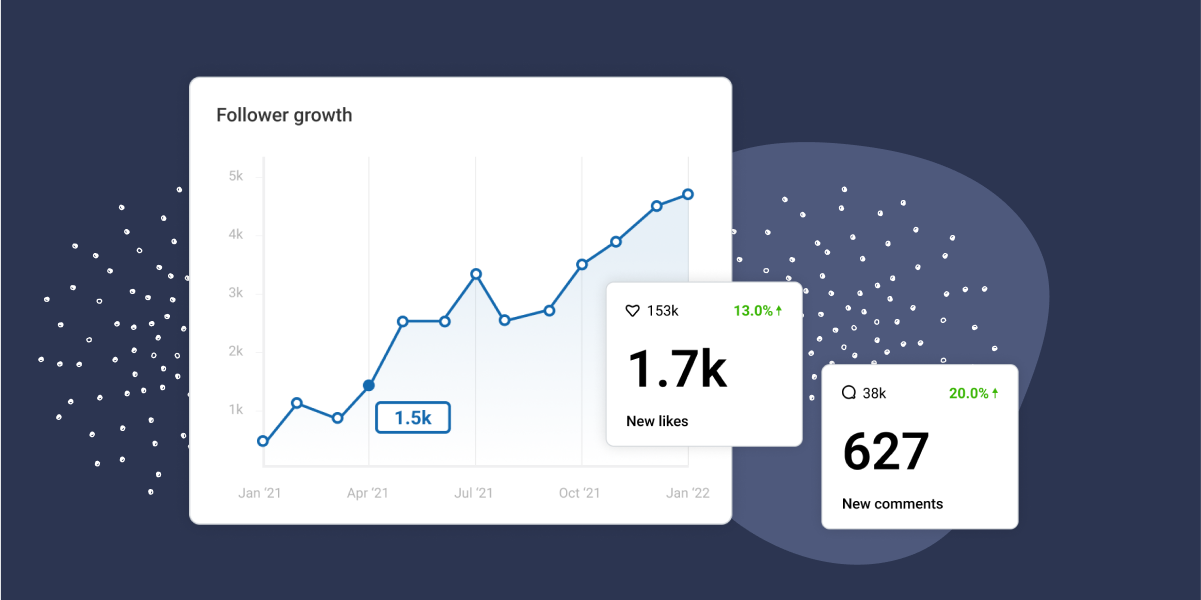
It was so popular that we decided to put it front and center on our new Analytics page so that you can easily keep track of your follower growth over time.
We also enabled a calendar to allow you to select periods of time and keep a watchful eye on the follower count by date. This is especially useful in special periods such as holidays and sales.
But what should you be doing with these stats?
Through our research, we found that “the average Instagram business account grows its followers by 1.69% each month”.
While every business is different, it’s good to keep this stat as a benchmark for growing your Instagram profile and brand.
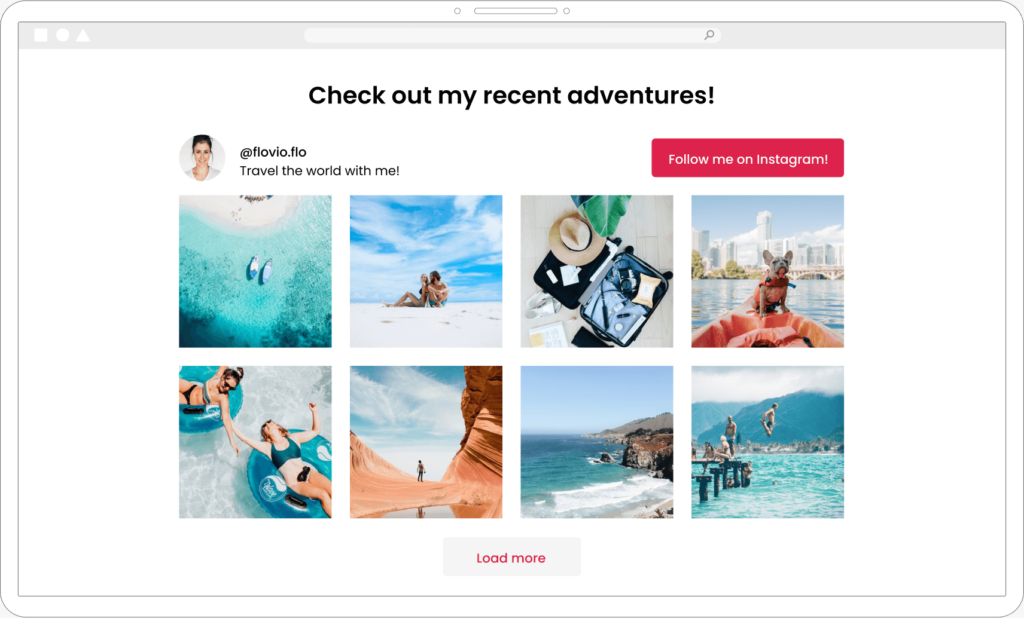
🔥 If you want to add a new way of increasing your follower count, include a “Follow Us on Instagram” button in your Instagram feeds to make it easier to turn website visitors into Instagram followers.
Post engagement ranks second on our list of Instagram analytics
Instagram provides engagement analytics for each post, but what about your Instagram feeds?
Knowing what sort of content is winning your audience’s attention is key to growing your brand. When it comes to Instagram feeds on your website, this still holds true.
The interesting thing here is that you’ve got two variables: the Instagram feed itself and the location of the feed on your website.
We decided to tackle both through Spotlight Analytics.
You are able to track clicks on individual posts which in turn will let you know which ones your visitors are interacting with. We also included the ability to track which type of posts your visitors are engaging with.
📸 This data will help you decide on which format you should focus on in your marketing strategy. Frequently posting that same type of post will help strengthen your brand.
The next thing to look out for when it comes to Instagram feeds on your website is their location such as whether it’s an Instagram feed in your footer or on a dedicated page.
In Spotlight Analytics, we decided to give you the ability to compare one feed to another based on their position on the website.
👀 Knowing where your Instagram feeds perform best across your website will give you the insight you need to focus on the areas most likely to drive engagement.
Like count vs comment count
While our participants favored likes over comments, both are necessary when it comes to the Instagram algorithm.
“Instagram has confirmed comments and likes are important when it comes to feed ranking — so it’s a great idea to encourage as many as possible for your posts.”
Later
One of the best ways to do this is to use intriguing captions. While you can’t force engagement, you can definitely work on creating genuine connections by being true to yourself and your brand.
✍️ If you need help writing your captions, we’ve created a short guide to get you started.
Back in Spotlight Analytics, this stat made it obvious to us that we need to double down on Instagram Insights within the plugin.
That’s why we added like and comment counters to help you analyze your feeds in detail without having to leave the WordPress dashboard.
35%+ of participants post a few times weekly, 50% post daily
When it comes to brands, posting regularly is key to keeping engagement up. With all the clutter on social media platforms, you have to keep up.
In fact, “it is generally recommended to post to your Instagram feed 2-3 times per week”.
However, don’t go overboard and post multiple times daily, unless you’re posting Instagram Stories. If you want to post more than one photo, opt for galleries to group up your posts.
🚀 In fact, during Instagram’s Creator Week in June 2021, Instagram’s vice president of product Adam Mosseri suggested that posting 2 feed posts per week and 2 Stories per day is the ideal recipe for growing your following.
42% of participants chose photos as their number one Instagram medium, with videos coming in second place
Photos were by far the most popular format among our participants.
But should you be diversifying more?
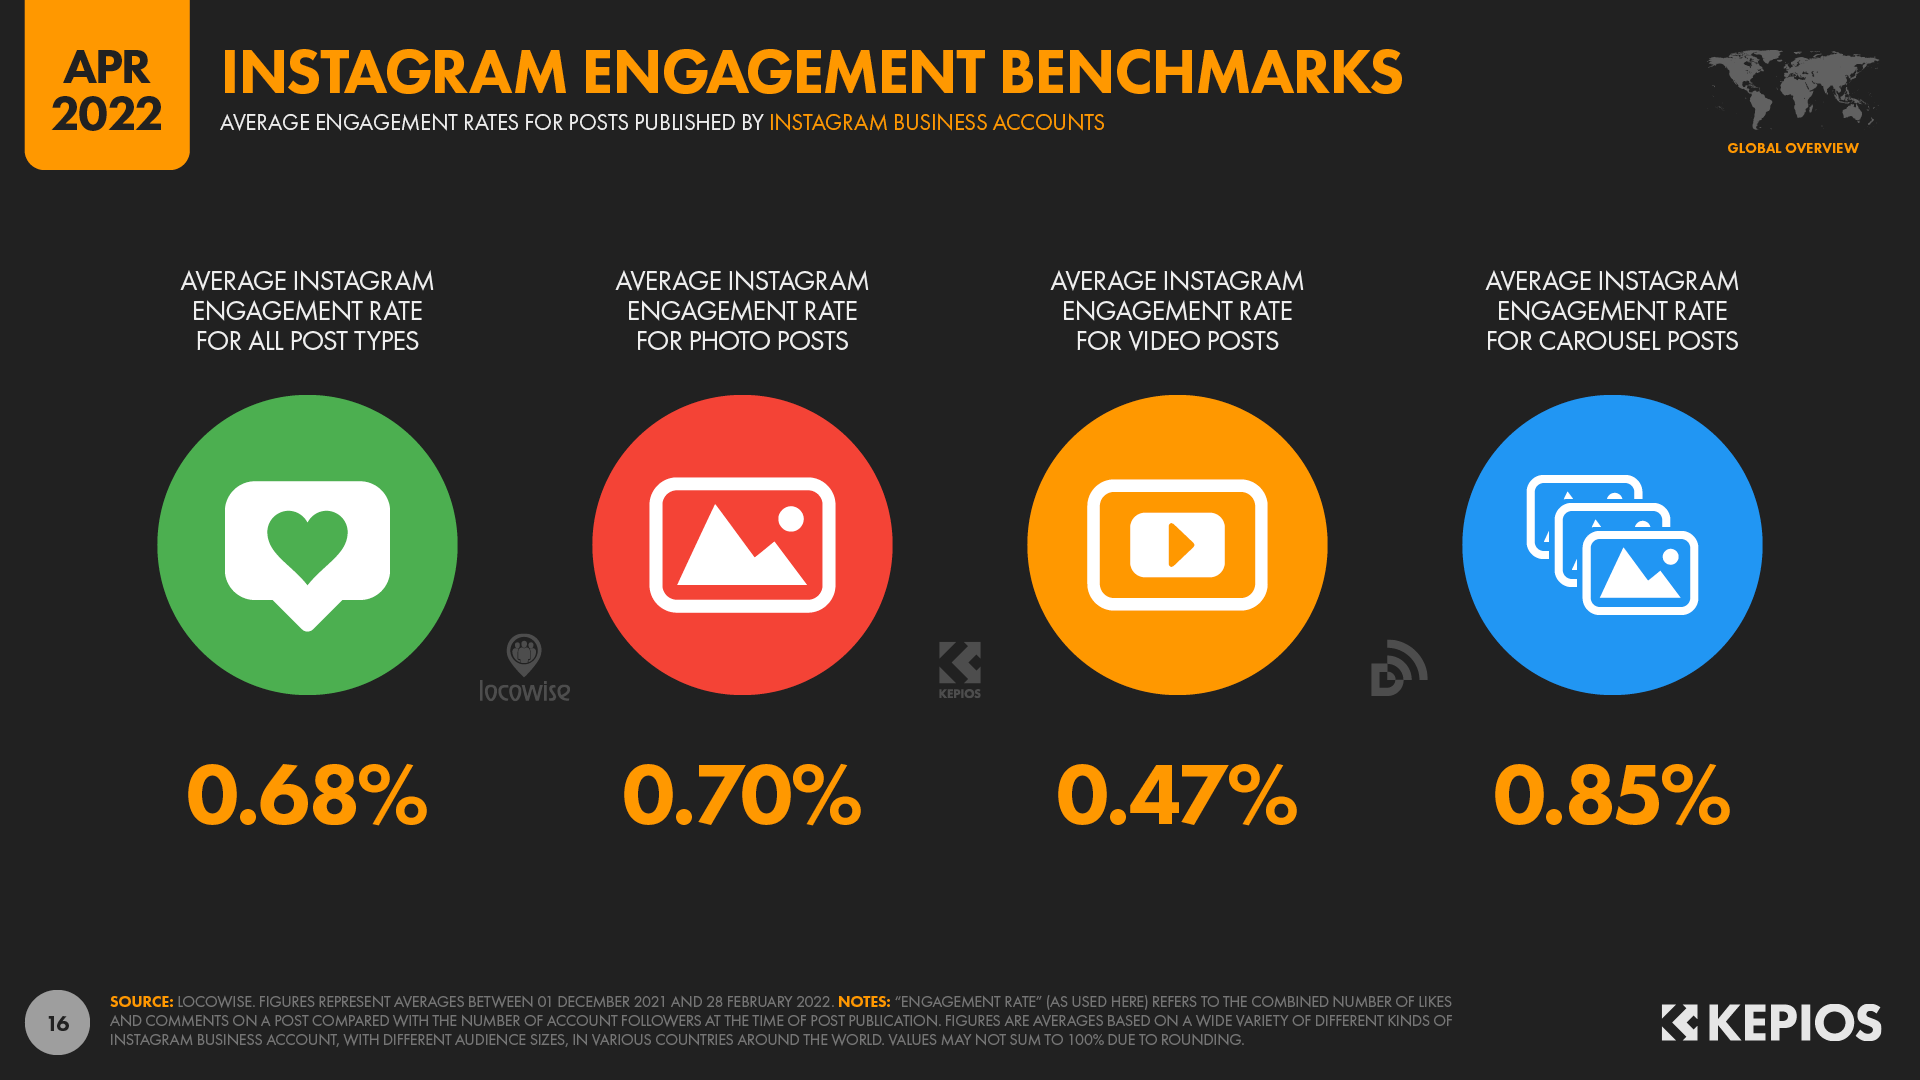
Here’s what’s interesting … DataReportal reports that the average engagement rates “vary by the ‘format’ of the published post, with some types of content delivering significantly higher levels of average engagement compared with others.”
While carousel or gallery posts had slightly more engagement than photo posts, our research tallies with our survey results as videos came in with a lower stat.
📈 A good mix of posts will help increase your brand’s engagement, so try to diversify your posts as much as possible.
When it came to Spotlight Analytics, we included various stats and engagement analytics to then stay on top of your post types. These will help you track what works for your brand.
Reels were not so popular among our voters
Reels have been increasing in popularity. In fact, Hootsuite claims that “reels have become Instagram’s fastest-growing feature worldwide.”
While not so common among our participants, the reel format is definitely one to keep an eye out for and try out. Plus, it’s great for brands!
🤳 Who knows? You might get featured on the Explore page, which 50% of Instagram users use every month.
Conclusion
That concludes our survey results. I hope you’ve found it as interesting as we have!
We’d like to thank all participants for helping us understand the Instagram platform better and to shape Spotlight’s newest plan: All Access.
Keep track of your Instagram analytics by embedding anonymously trackable Instagram feeds on your website using Spotlight. Purchase Spotlight All Access today to get started.
Did you find any of these findings interesting? Are you experiencing something different with your own Instagram accounts and feeds? Let us know in the comments section below.

